.avif)
Last summer, our CEO cornered me in the break room. "Sarah, we're bleeding customers. Churn hit 31% last quarter, and the board is asking questions I can't answer."
I figured we knew our customers pretty well. We had satisfaction surveys, tracked some basic metrics, and did the usual monthly reviews. Boy, was I wrong.
Turns out I didn't know jack about what customers went through when dealing with us. The next eighteen months were brutal, learning customer experience analytics while trying to stop the customer exodus.
We managed to cut churn down to 15%. Here's how we did it and what nearly killed us along the way.
Understanding Customer Experience Analytics in Practice
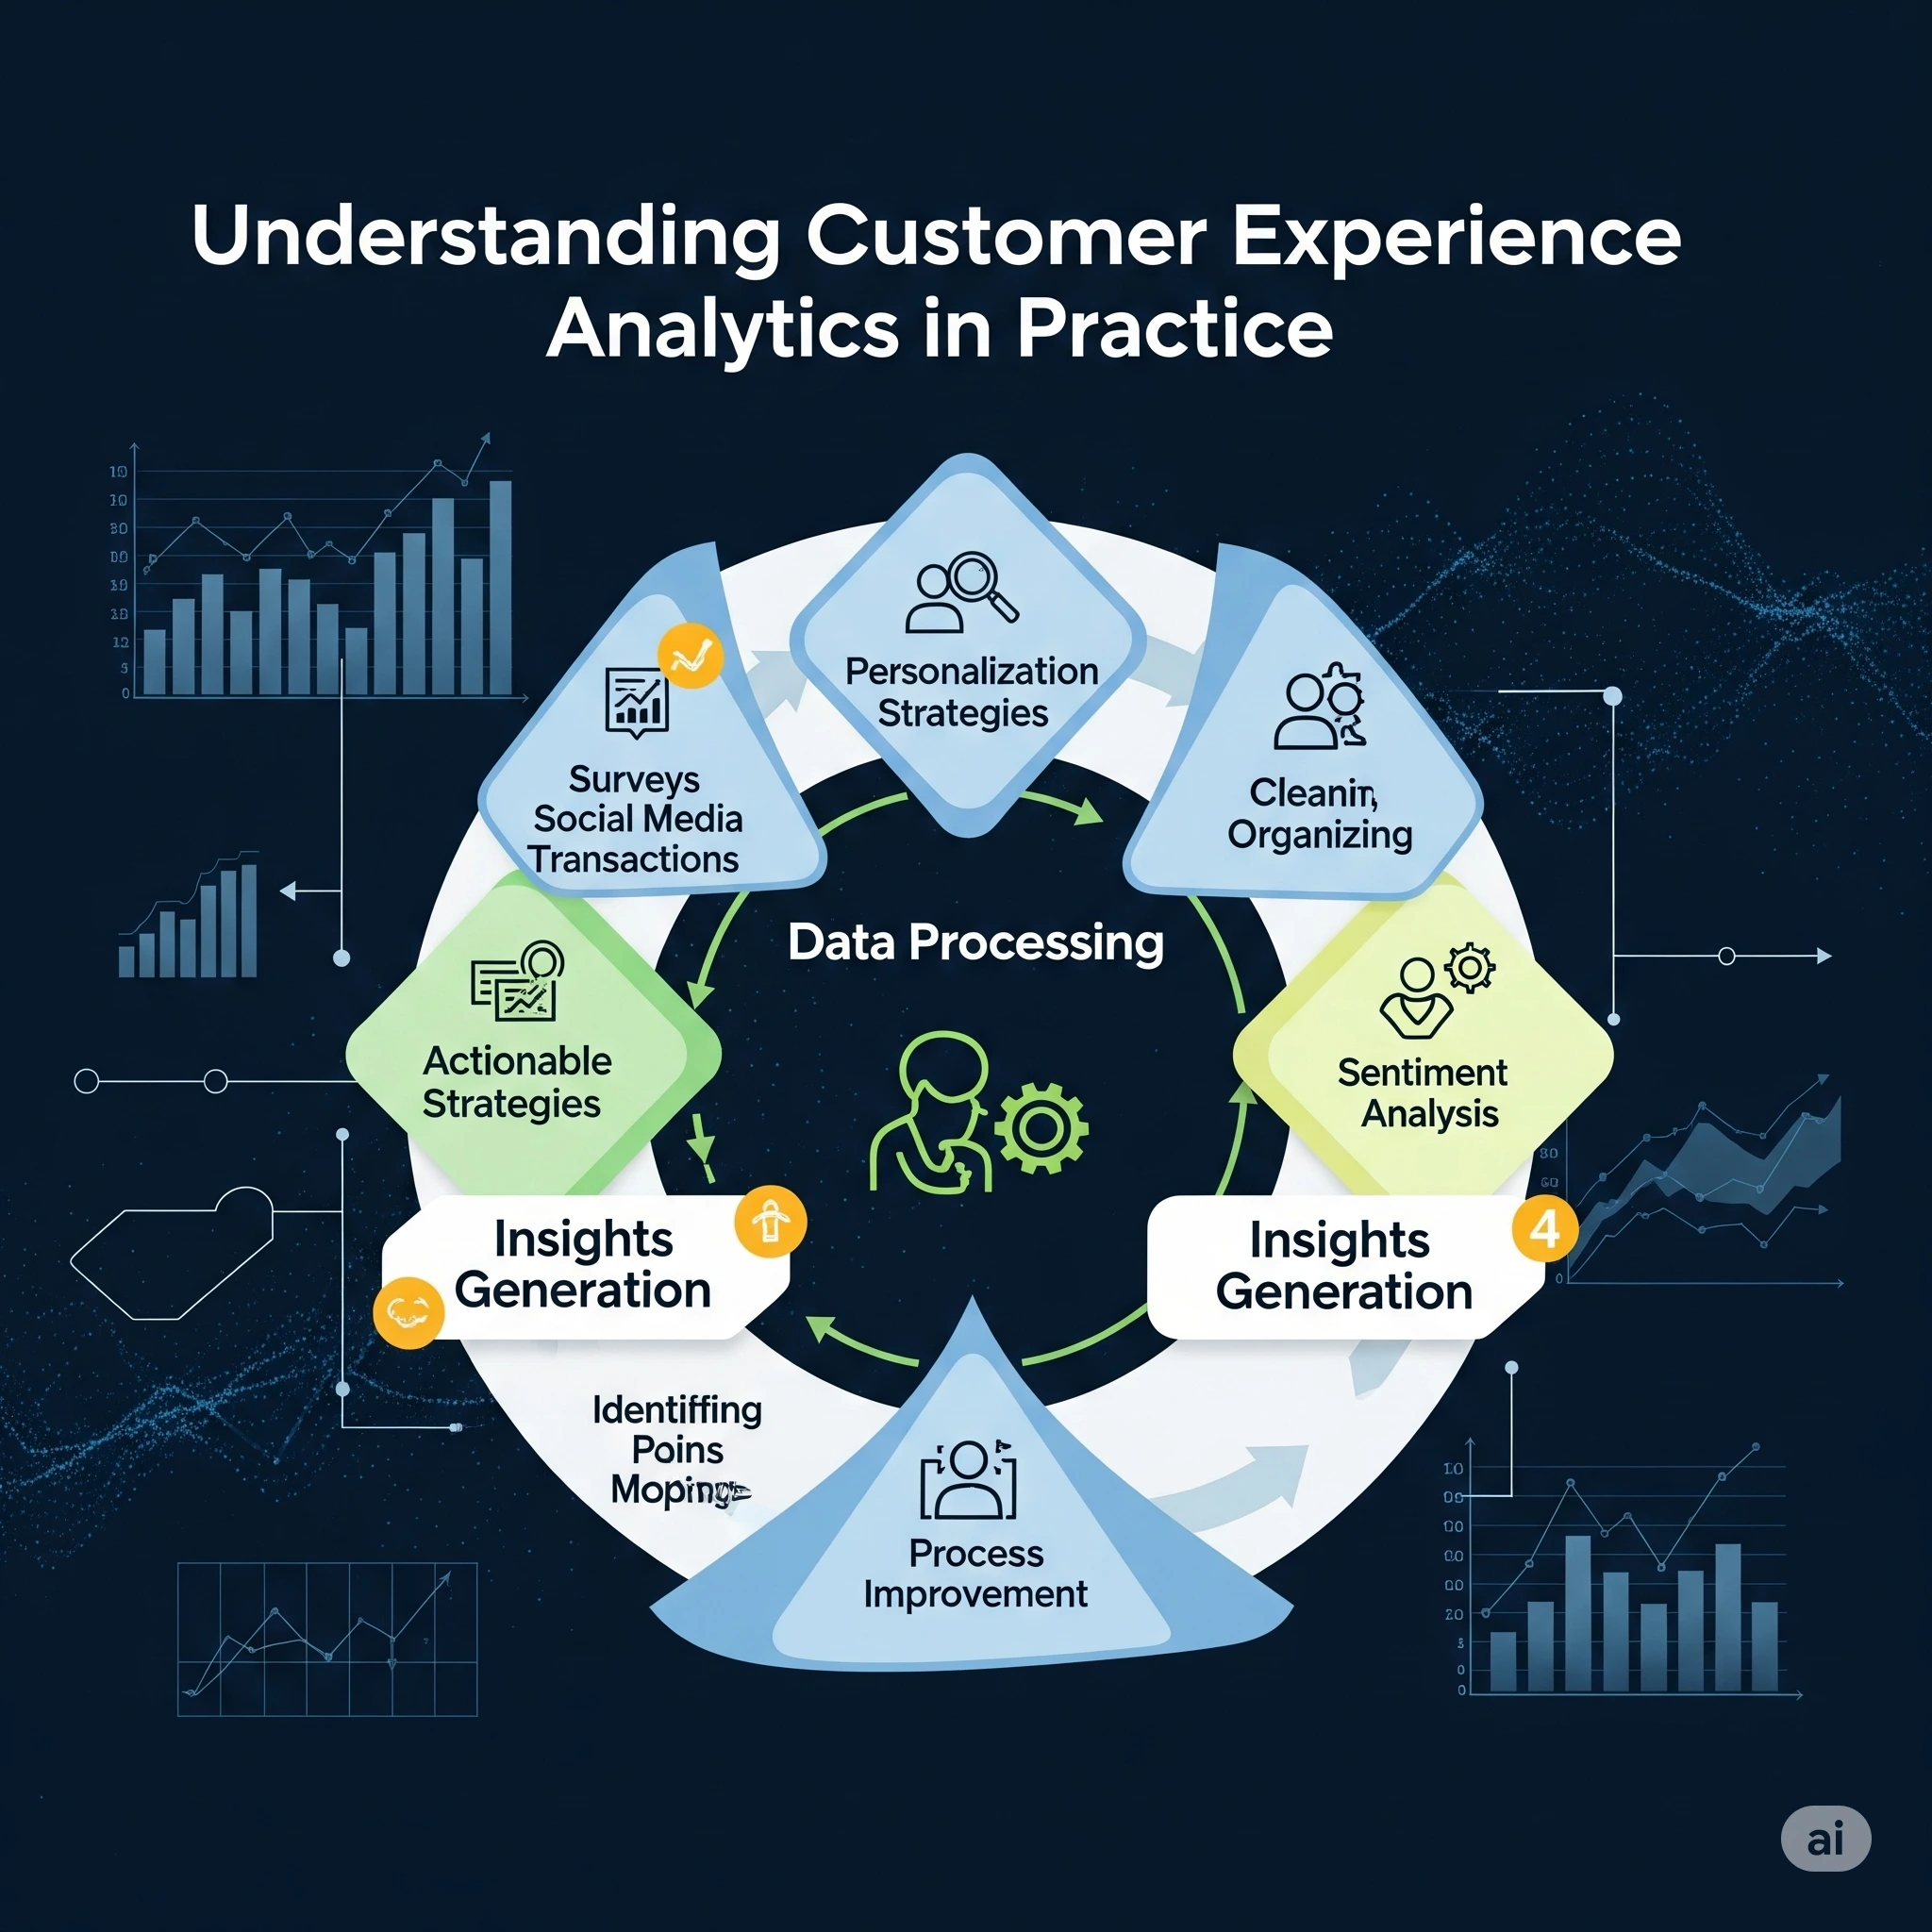
Customer experience analytics is basically being Sherlock Holmes for your business. You're collecting clues about why customers either love you or want to throw their laptop out the window after dealing with you.
Most companies think this means sending out surveys. That's like trying to understand a marriage by only asking about the wedding day. You miss 99% of what matters.
Real CX analytics tracks everything, how many times people reset their passwords, which FAQ articles they read before giving up, how long they sit on hold before hanging up, what they post about you on Reddit when they're frustrated.
The problem is, this data lives everywhere. Marketing has Google Analytics, support uses Zendesk, and sales has their spreadsheets that make sense to nobody else.
I spent weeks just figuring out where all our customer data was hiding. Found customer information in systems I forgot we even paid for.
What is customer experience analytics?
Customer experience analytics is the process of collecting, analyzing, and acting on customer behavior data to improve satisfaction, retention, and lifetime value. Unlike simple surveys, it provides a 360-degree view of how customers interact with your brand across every touchpoint.
Strategic Value of Customer Experience Analytics for Business Growth
I used to think customer satisfaction was just something executives mentioned to sound caring. Then I saw what one angry customer could do.
This guy posted on Twitter about our broken checkout process. Got retweeted 400+ times. We could track at least fifteen people who mentioned seeing it before deciding to go with a competitor instead.
Meanwhile, happy customers don't tweet anything. They just quietly pay their bills every month.
But here's what woke me up: we were spending $180 acquiring each customer through ads. Keeping existing customers happy? Maybe $50 in better support.
Losing 31% of customers annually was like setting $200,000 on fire every year.
I calculated that every point improvement in our customer experience score translated to roughly $80,000 in additional revenue. Not from raising prices, just from people buying more and staying longer.
That's when this became a survival issue, not a nice-to-have project.
Analytics to improve customer experience&Using analytics to improve customer experience
Many companies are now focused on analytics to improve customer experience because it directly impacts retention and revenue. By using analytics to improve customer experience, we were able to identify customer pain points that traditional surveys never revealed.
Core Components of Effective Customer Experience Management
After analyzing thousands of customer interactions, four things separated the customers who stuck around from the ones who left angry Yelp reviews:
Getting Help When You Need It. Our contact page had five different phone numbers and three email addresses. Nobody knew which one worked. Customers got transferred around like they were playing hot potato. We created one main support number and trained everyone to either solve the problem or find someone who could within two minutes. Customer effort scores improved overnight.
Doing What You Promise, not about being lightning fast, about meeting expectations you set. If you say "we'll call back within 4 hours," then call back in 3 hours. We started tracking every promise we made. Sounds excessive, but customer satisfaction jumped when people realized we meant what we said. Caring About People, Customers can tell instantly if your support person wants to help or just wants to end the call.
I tracked customer feedback by individual rep. The difference was shocking, our best person got 94% positive ratings, our worst got 31%. Same training, totally different attitudes.
Remembering Customer History A customer paying you for three years shouldn't get treated like someone who signed up yesterday. We flagged long-term accounts and gave them priority support. Customer retention for accounts over two years went up 45%.
Customer experience analytics for marketing
Beyond retention, we started applying customer experience analytics for marketing. By aligning support insights with campaign data, our marketing team could target messages based on real customer frustrations and needs. If you’re exploring customer experience and marketing analytics, check out our detailed breakdown of analytics strategies for modern businesses.
Customer Experience Analyst Responsibilities and Daily Operations
My job didn't exist when I started here. Now every company wants one, but most don't know what we do.
Mornings, I dig through data from everywhere: website analytics, support tickets, customer surveys, social mentions, and billing issues. Looking for patterns that explain customer behavior. Last month, I noticed customers who used our mobile app renewed at much higher rates. Took me a while to realize the app made checking account info way easier. Now we push app downloads during onboarding, and renewals are up 33%.
Afternoons, I translate data into recommendations that people might implement. Harder than it sounds because nobody likes being told their process is broken. I learned to speak in revenue, not feelings. "This will improve customer happiness" gets ignored. "This will reduce churn by 7% and save $140,000." gets budget approved immediately.
Essential Customer Experience Metrics and Key Performance Indicators
Strong data analytics for customer experience helps tie metrics like CSAT, NPS, and churn into actionable insights. In fact, ongoing data analysis in customer experience showed us that lowering customer effort scores had a bigger revenue impact than simply raising satisfaction ratings.
Everyone tracks different numbers, but most don't mean much individually.
Customer Satisfaction (CSAT)is Good for measuring specific interactions, but it's just a moment in time. Someone might rate their support call 4/5 and still cancel next month. CSAT tells you about one conversation, not their overall relationship with you.
Net Promoter Score (NPS)is Better because it predicts behavior. People who say they'd recommend you usually stick around. But NPS varies wildly by industry, 25 might be amazing for telecom, but terrible for software.
Customer Effort Score (CES): My favorite because it's actionable. When customers say something was difficult, you know exactly what needs fixing. We dropped average effort scores from 4.3 to 2.8, and support tickets fell 41%.
Churn Rate: The ultimate reality check. You can have beautiful satisfaction scores, but if people keep leaving, something's fundamentally broken.
The trick is looking at these together. High satisfaction plus high effort? That's someone who likes your product but hates dealing with your company.
Implementation Strategy: Building Customer Experience Analytics Infrastructure
Every case study makes this sound clean and organized. Ours was pure chaos.
The first step was admitting our customer data was a complete mess. Information was scattered across nine different systems that couldn't talk to each other. Our CRM had duplicate records, billing had the wrong contact info, and support used different customer IDs for the same people.
Cleaning up took eight months and almost made our IT guy quit. Companies winning today aren’t the ones with the prettiest dashboards, they’re the ones who use analytics to improve customer experience
We started simple, just tracking support tickets and survey responses. Once we proved insights could drive revenue, suddenly everyone wanted to fund better analytics tools.
The biggest mistake was trying to measure everything at once. In month one, we tracked 51 different metrics and burned out our team in six weeks. Now we focus on three things that directly impact revenue.
Key lesson: involve frontline people from day one. Support reps know exactly where customers get stuck, they just need someone to listen and act on it.
Common Implementation Challenges and How to Avoid Them
Survey Fatigue: We surveyed customers after every interaction. Response rates dropped to 1.8% and people started complaining about the surveys themselves. Now we survey strategically and get 22% response rates with better feedback.
Dashboard Obsession Numbers tell you what happened. Customer comments tell you why. I used to stare at charts for hours trying to decode metrics. Now I spend more time reading actual feedback and get much clearer insights.
Data Collection Without Action: Companies spend thousands on customer analytics software, then let insights sit in unused reports. We have monthly meetings where we pick one insight and commit to fixing it within 30 days.
Perfectionism Paralysis Waiting for perfect data means never starting. You'll never have complete information. Start with what you have and improve the collection as you learn what matters.
Future Trends in Customer Experience Analytics Technology
The future lies in combining customer experience and marketing analytics to create predictive engagement models. With AI-driven data analytics in customer experience, companies can anticipate churn risks, personalize outreach, and optimize support in real time.
AI and Machine Learning Technology are getting good at spotting patterns humans miss, but they won't replace analysts soon. We use AI to flag at-risk customers, but humans figure out what to do about it.
Real-Time Analytics Instead of learning that customers were unhappy after they left, we're starting to predict problems before they explode.
Voice Intelligence: We can analyze customer calls while they're happening and coach reps in real-time. Expensive but incredibly effective for training.
Honestly though? Most companies should nail the basics first. Clean data, clear processes, and people who care about solving problems matter more than fancy AI.
Best Practices for Customer Experience Analytics Implementation
Don't fall for consultants selling "complete customer experience transformations" for six figures. That's code for "we'll disrupt your business for a year while charging you a fortune."
Pick one specific problem costing you money now. Maybe long hold times or confusing signup flows. Fix that first, measure results, then tackle the next issue.
Get executive support, but don't let them micromanage. They need to understand why customer experience analytics matters and provide resources, but let your team do the detective work.
Remember, there's a real person behind every metric. Someone who chose to trust you with their money and time.
Companies that master this will destroy competitors still treating customer feedback as an afterthought. The question is whether you'll lead or follow.
Conclusion
After building our customer experience analytics program from nothing, here's what I know: it's not about perfect data or expensive tools. It's about actually listening to what customers tell you through their behavior and then doing something about it.
Companies winning today aren't the ones with the prettiest dashboards, they're the ones who act on what their data shows. Start small, fix one problem at a time, and remember there's a human behind every number.
Ready to Improve Your Customer Experience?
Stop guessing why customers leave and start using data to keep them happy. If you need help getting your customer experience analytics program started, let's discuss your specific situation.
We'll talk about your current challenges and show you exactly how analytics can solve them.
Frequently Asked Questions
How long before we see real results from customer experience analytics?
Quick wins show up within 30-45 days, things like better email response rates or shorter hold times. The big revenue, moving improvements take 3-4 months because you need time to collect data, spot real patterns, and implement changes that stick.
Do we need expensive software to get started?
Not at all. Start with what you already have, your CRM, support tickets, and basic surveys. We got our biggest early insights using Excel and free analytics tools. Invest in specialized software after you prove the concept works.
Will this replace our customer service team?
Never. Customer experience analytics makes your team better by showing exactly where customers struggle. Your people still handle relationships and complex problems, they just get better data to guide their decisions.